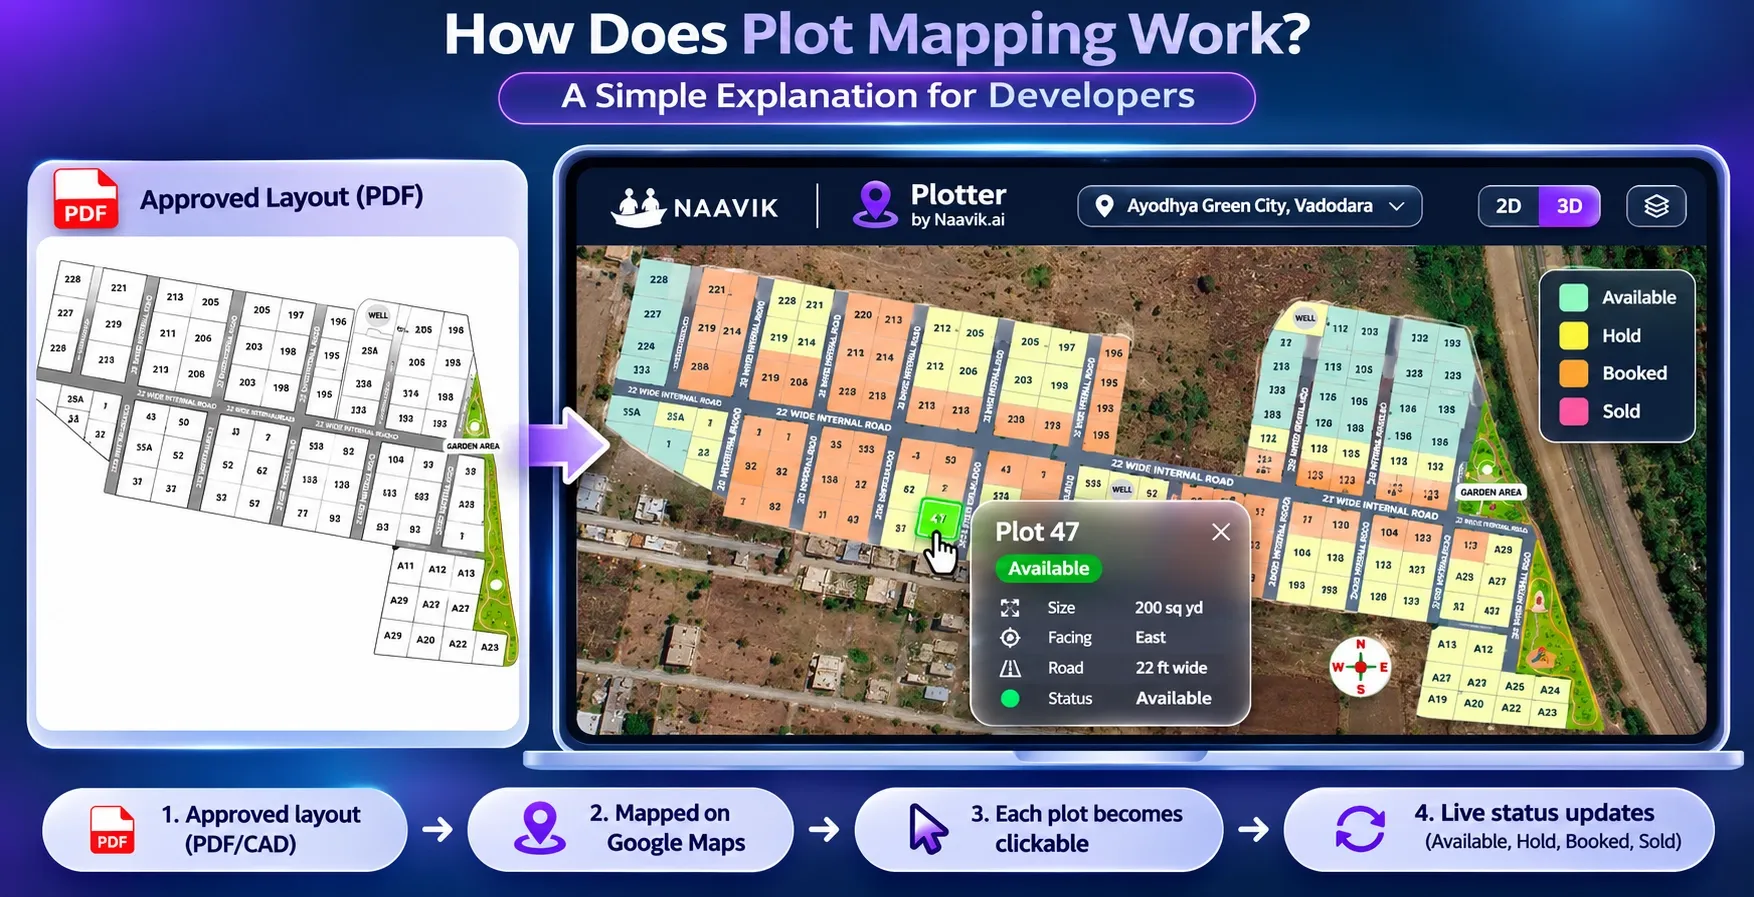
Your layout is approved. It sits in a PDF on your sales team's phones. A buyer asks where Plot 47 is, which way it faces and whether it's still free. Your team opens the PDF, then checks an Excel sheet, then calls the site office.
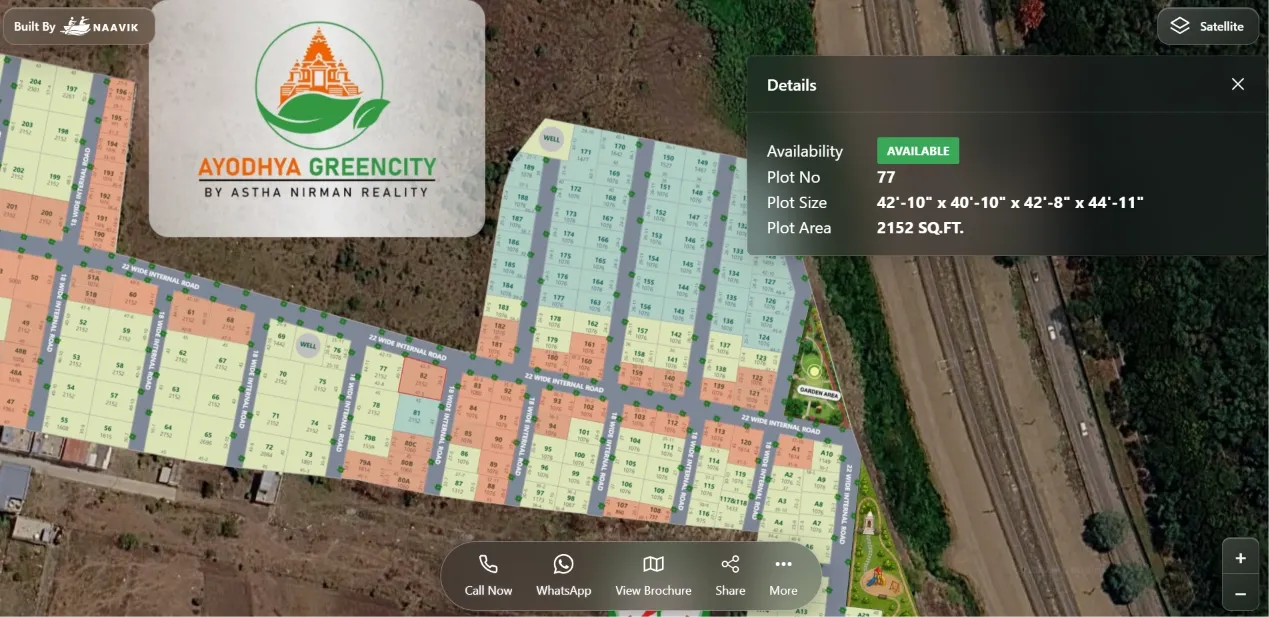
Plot mapping fixes this. It takes your approved layout and places it on the real location of your land on Google Maps. Each plot becomes its own clickable shape with its own details: number, size, facing and status. When a plot is booked, its status changes on Google Maps. Buyers see where each plot sits and which plots are still available, and your team works from one up-to-date view.
This guide explains how plot mapping works step by step, what you need before you start and the mistakes that cause problems later.
Key takeaways
- Plot mapping turns an approved layout into a plot map on Google Maps where every plot is a separate, clickable record.
- The layout is placed on the actual location of your land, so buyers can see roads, landmarks and surroundings.
- Each plot carries its own data, including number, dimensions, area, facing and status.
- A live plot map updates as plots are booked, so buyers and your sales team see the same availability.
- Good plot mapping starts with clean inputs: the final approved layout, a correct plot schedule and plot numbers that match your sale documents.
What plot mapping means
Plot mapping is the process of turning a plotted layout into a digital plot map on Google Maps where each plot can be identified, viewed and tracked. For a land developer, it's the bridge between the approved drawing and the sales process.
It helps to separate it from two things it's often confused with.
Plot mapping is not government land record mapping
State land record maps, such as village maps or Bhu Naksha in many states, show survey numbers and land parcels for revenue records. They tell you what land exists and who owns it. A developer's plot map works at a different level. It shows the plots inside your project, such as Plot 1 to Plot 180, and helps you sell them.
Plot mapping is not drawing the layout
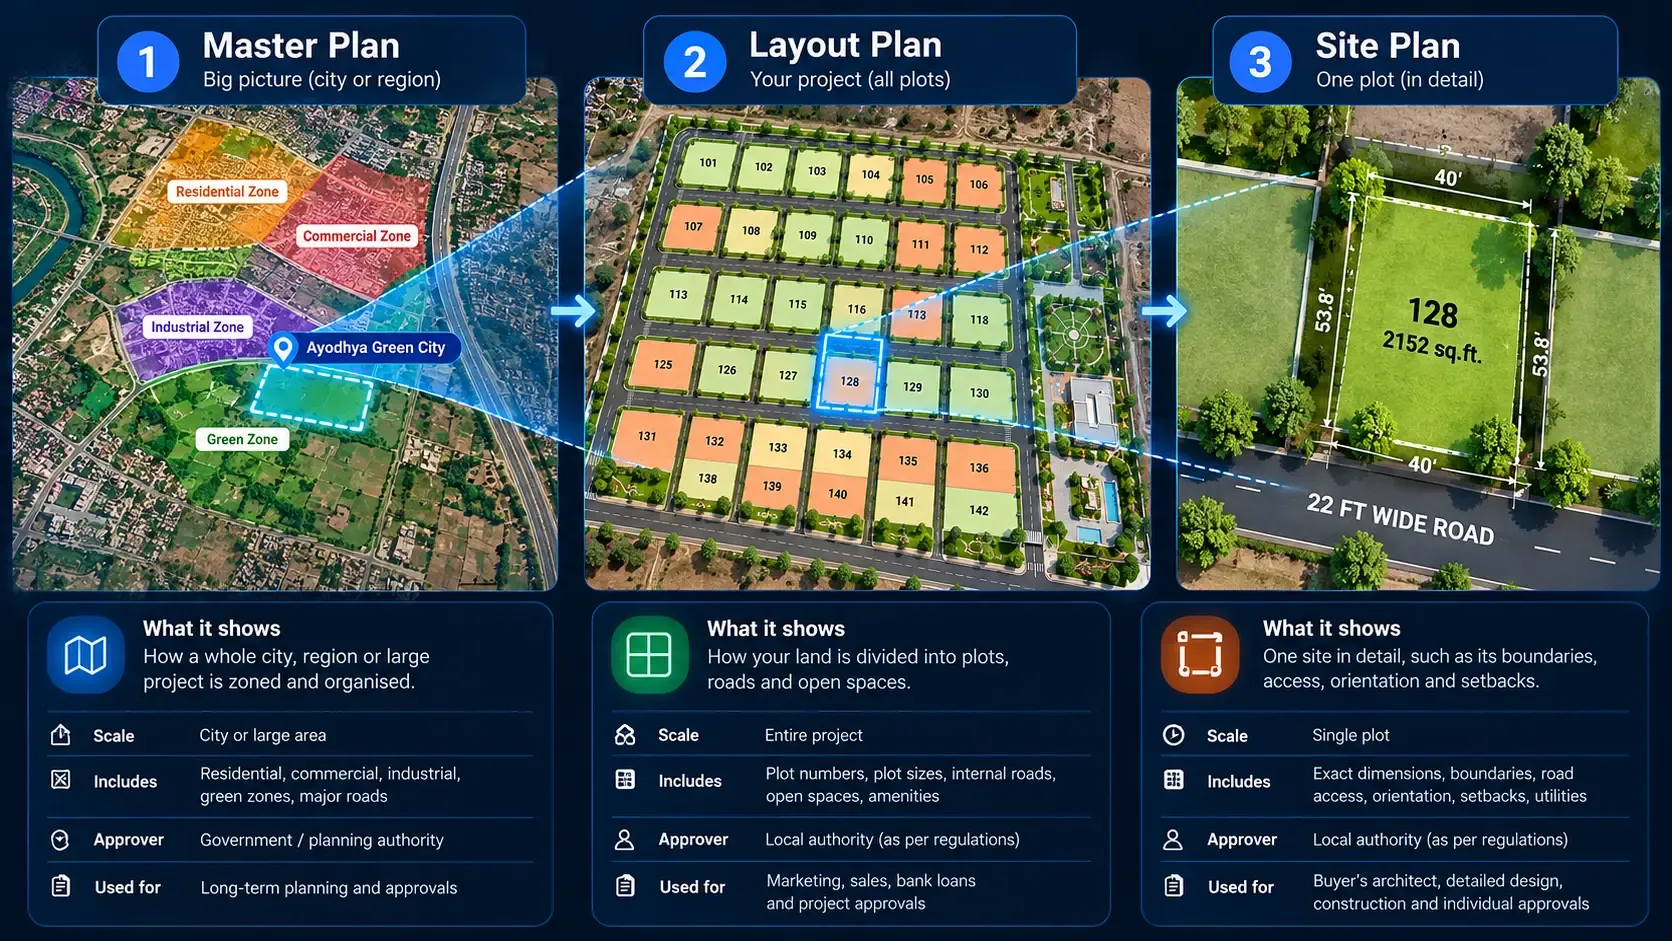
Your architect or planner draws the layout. That drawing decides plot sizes, roads and open space, as covered in our guide on what a plotting scheme is. Plot mapping comes after. It takes the approved drawing as it is and makes it usable for buyers and your sales team.
How plot mapping works, step by step
Most plot mapping follows the same sequence, whatever the project size.
1. Start with the final approved layout
The approved layout is the source of every plot on Google Maps. It should be the latest version, with any revisions from the planning authority already included.
If you map a draft and the approval changes plot sizes or road widths later, every affected plot has to be redrawn. Wait for the final layout, or plan for a second round of mapping.
2. Place the layout on the real site
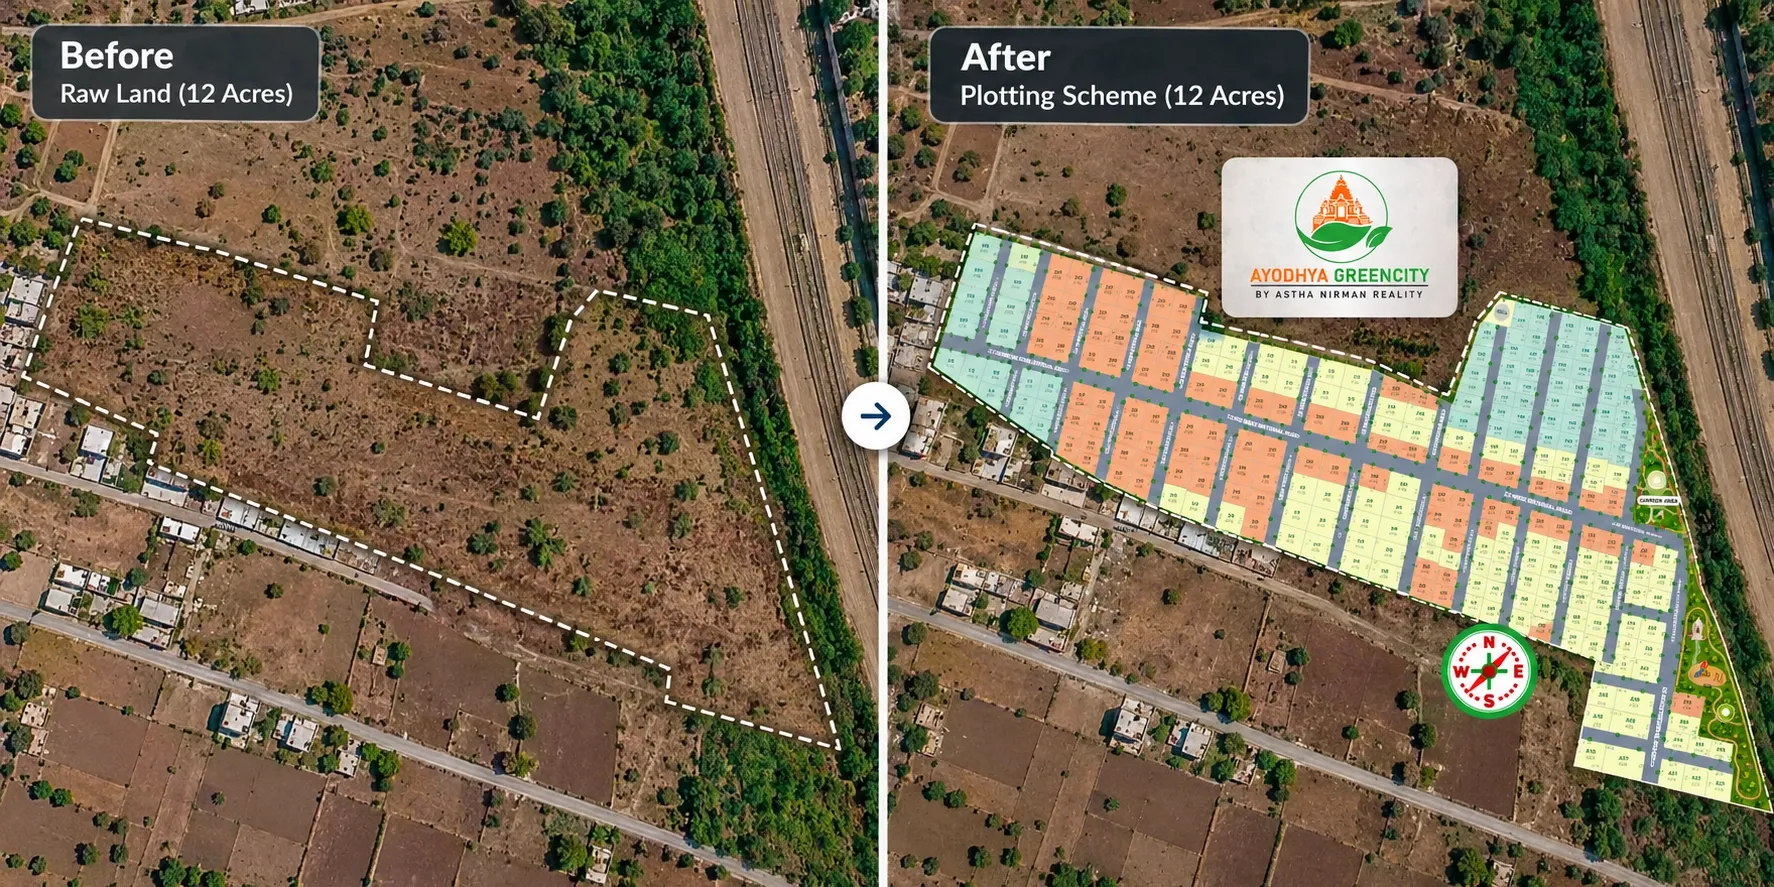
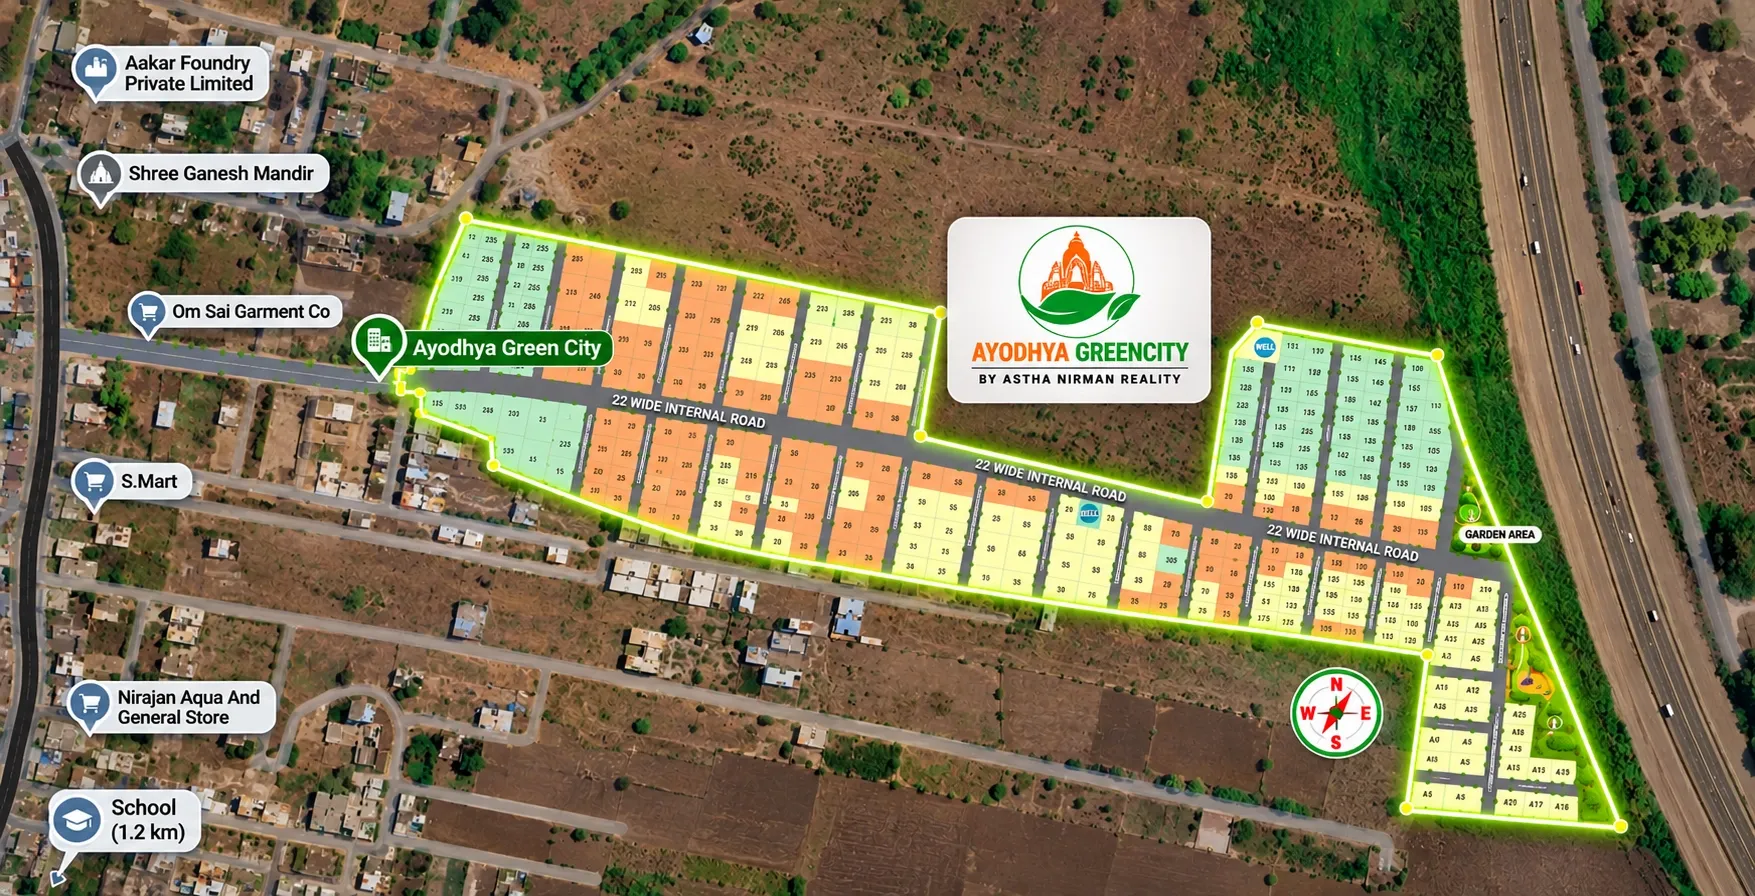
Next, the layout is placed over Google Maps (or OpenStreetMap, if you prefer). The project boundary is lined up with the actual land, using reference points like boundary corners, the access road or a known landmark.
This step matters more than it looks. When the layout sits in the right place, buyers can see the highway, the school down the road and the distance to the city. A PDF can't show any of that.
3. Turn each plot into its own shape
Every plot in the layout becomes a separate shape on Google Maps. Each shape gets its plot number, exactly as it appears in the approved layout and your sale agreements.
This is the step that makes the Google Maps layout clickable. A buyer can tap a single plot instead of zooming into a crowded PDF. Roads, gardens and amenity areas are mapped too, so the full layout reads clearly.
4. Attach plot details
Each plot shape is linked to its details. This usually comes from your plot schedule, the list of plots with their measurements. Typical details include:
- Plot number
- Dimensions and area
- Facing direction
- Road width in front of the plot
- Plot type, such as corner, park-facing or main-road plot
- Price or price band, if you choose to show it
These are the details buyers ask about first. Our guide on how to read a site plan shows how hard they are to work out from a static drawing.
5. Link each plot to its status
This is what separates a live plot map from a digital picture. Each plot carries a status, usually one of four:
- Available: open for sale
- Hold: temporarily reserved, for example while a buyer arranges payment
- Booked: booking amount received
- Sold: sale completed
Each status gets its own colour. When your team updates a booking, the plot changes colour on Google Maps. Buyers and sales staff see the same availability, which reduces the risk of double booking.
6. Add the surroundings
Buyers don't buy a plot only for what's inside the boundary. They also look at what's around it. A plot map can show nearby landmarks such as schools, hospitals, highways and railway stations, along with travel distances.
For under-development projects, this context does a lot of work. It shows buyers what the location offers before roads and gates are built. Our pre-launch plot marketing playbook covers this in more detail.
7. Share the Google Maps link
Once the plot map on Google Maps is ready, it needs to reach buyers. Common ways include:
- Embedding it on your project website
- Sharing a link on WhatsApp
- Printing a QR code on hoardings, brochures and the site office board
- Opening it on a tablet during site visits
A buyer who explores the project on Google Maps before visiting usually arrives with a shortlist. That makes the site visit shorter and more focused.
What you need before you start
Most delays in plot mapping come from missing or mismatched inputs. Gather these first.
Checklist for plot mapping
- The final approved layout, ideally as a CAD file or high-quality PDF
- The project boundary, with at least two or three clear reference points on the ground
- A plot schedule listing every plot's number, dimensions, area and facing
- Plot numbers that match your sale agreements and booking records exactly
- Current status of every plot, if sales have already started
- Prices or price bands, if you plan to show them
- A list of nearby landmarks you want buyers to see
- Photos, 360° media or a site tour video, if available
If your plot schedule lives in Excel, check it against the approved layout before you start. A plot listed as 150 sq yd in Excel and 165 sq yd in the layout will confuse buyers and your team.
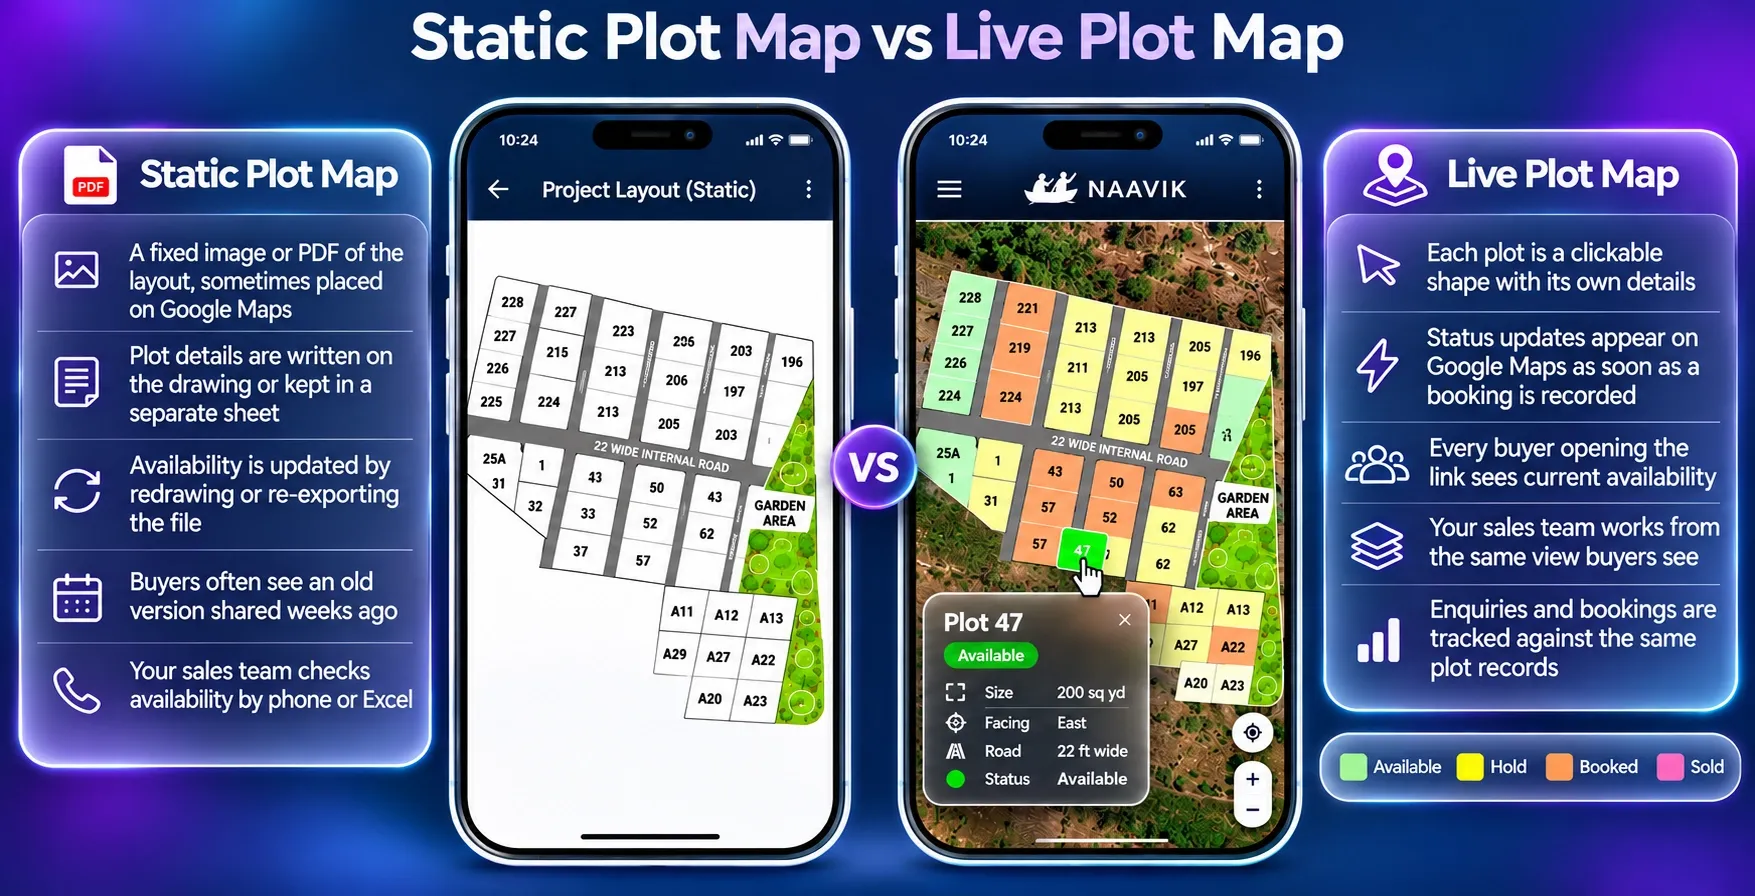
Static plot map vs live plot map
Not every plot map works the same way. The difference shows up once sales begin.
Static plot map
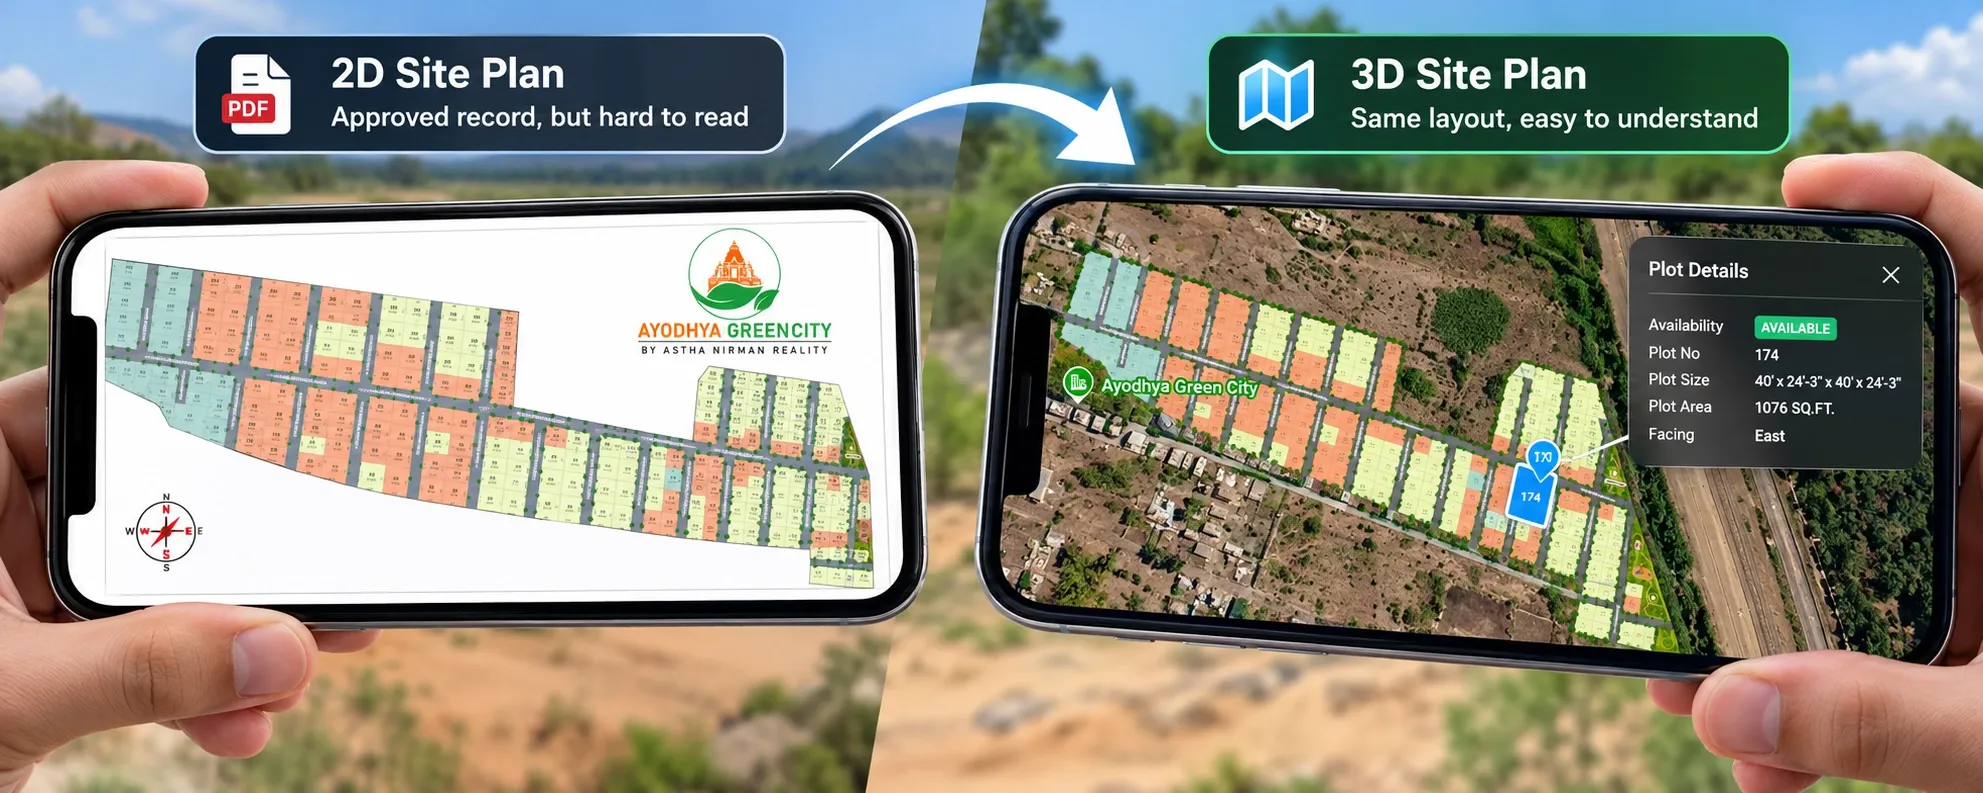
- A fixed image or PDF of the layout, sometimes placed on Google Maps
- Plot details are written on the drawing or kept in a separate sheet
- Availability is updated by redrawing or re-exporting the file
- Buyers often see an old version shared weeks ago
- Your sales team checks availability by phone or Excel
Live plot map
- Each plot is a clickable shape with its own details
- Status updates appear on Google Maps as soon as a booking is recorded
- Every buyer opening the link sees current availability
- Your sales team works from the same view buyers see
- Enquiries and bookings are tracked against the same plot records
A static plot map is better than a PDF alone. A live plot map on Google Maps changes how your team sells. For more on how layout formats affect buyer decisions, see our comparison of 2D vs 3D site plans.
Example: mapping a 180-plot project near Vadodara
This is an illustrative example, not a client case.
A developer has an approved plotted project of about 11 acres outside Vadodara. It has 180 residential plots between 120 and 250 sq yd, a garden, a clubhouse plot and a row of shops near the gate. Sales have already started, and 40 plots are booked.
Before mapping
- Buyers receive a PDF layout on WhatsApp.
- The sales team keeps bookings in an Excel sheet updated by the site office.
- A buyer in Pune asks whether any east-facing corner plots are left. The salesperson needs two calls and an hour to answer.
- Two brokers offer the same plot to different buyers in the same week.
The mapping process
- The team confirms the approved layout is final and matches the plot schedule.
- The layout is placed over Google Maps using the project gate and two boundary corners.
- All 180 plots, plus roads, the garden and the clubhouse, become separate shapes.
- Each plot gets its dimensions, area, facing and plot type from the schedule.
- The 40 booked plots are marked booked. The rest are marked available.
- Nearby landmarks, including the highway, a school and the railway station, are added.
- The Google Maps view is embedded on the project website and shared by link and QR code.
After mapping
- The buyer in Pune opens the project on Google Maps, taps the corner plots and sees their facing and which ones are still available.
- Brokers share the same live link, so they can't offer a booked plot by mistake.
- The site office updates a booking once, and the Google Maps view changes for everyone.
Five plot mapping mistakes to avoid
1. Mapping a draft layout
If approval changes the layout, the plot map on Google Maps has to change too. Map the final approved version.
2. Plot numbers that don't match your documents
If Plot 47 on Google Maps is Plot 49 in the agreement, you'll have disputes. Use the exact numbering from the approved layout and your sale records.
3. Placing the layout in the wrong position
A layout shifted a few metres on Google Maps can show a plot on the wrong side of a road. Line it up using clear reference points and check it against the site.
4. Updating status in two places
If bookings go into Excel and Google Maps is updated later, the two will drift apart. Make the Google Maps view your single place for status updates.
5. Leaving out the surroundings
A plot map that shows only the plots misses the biggest advantage of Google Maps. Add landmarks and connectivity so buyers can judge the location.
Where Plotter by Naavik.ai fits
Plotter by Naavik.ai is plot management software that turns static layouts into interactive 3D site plans with real-time plot availability.
It handles the full plot mapping process described above. As plot mapping software built for land developers, Plotter places your approved layout over Google Maps or OpenStreetMap and turns every plot into a clickable shape. Each plot shows its details and colour-coded status: available, booked, hold or sold. Your team updates bookings in one place, the built-in CRM captures every enquiry and the analytics dashboard tracks visitors, leads and bookings.
You can embed the Google Maps view on your website, share it by QR code or link, and let buyers reach your team on WhatsApp or by call. That makes it easier to sell plots online, including to buyers who can't visit the site.